
Quarterly Review and Outlook:
March 2026
"If There's One Thing That's Certain In Business, It's Uncertainty."

DKing@fcbanking.com
412-208-7680
Connect on LinkedIn
A Look Back
The above quote is by Stephen Covey, author of the 1989 best seller “7 Habits of Highly Effective People.” While not a popular song, as per the Review & Outlook norm, I felt it was apt for the time in which we find ourselves.
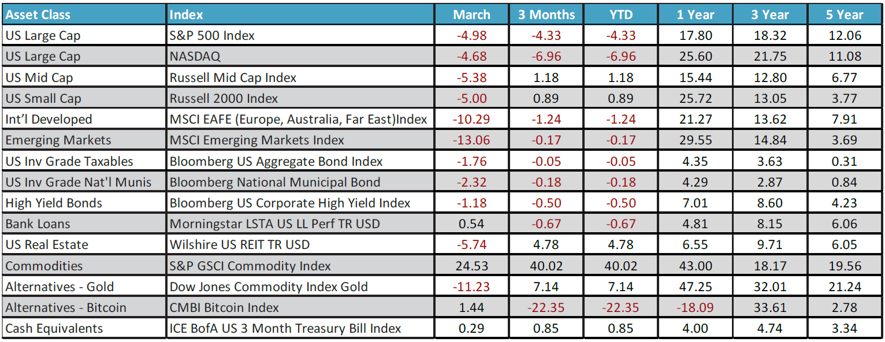
Global markets experienced elevated volatility in March with the launch of Operation Epic Fury, a joint mission between the United States and Israel against Iran. USA-listed oil prices spiked from a pre-combat level of $67.21 to $91.27 just a week later, a rise of 35.8%. By the end of the month, oil was trading at $101.54. The main cause of this was Iran’s closure of the Strait of Hormuz, a narrow passageway through which 20% of daily global oil supply flows, alongside other goods and commodities: natural gas, industrial metals and fertilizer. This drove investors to seek shelter where they could, and options were limited. This risk-off mindset led to broad declines in equity prices for the month. The S&P 500, the bellwether index for US-based equities, dropped -4.98% in the month, its worst month in a year. International equities performed worse, reflecting their heavier reliance on oil that passes through the strait. The MSCI EAFE Index, which represents international developed markets, fell -10.29% in the month. Emerging markets fared poorer, losing -13.06%. These countries have higher levels of GDP growth than the developed world and are more sensitive to price shocks for inputs to their production. The relative outperformance of US stocks highlights the fact that as a net-exporter of energy the US is better insulated from energy market price shocks. It is worth mentioning that the one pocket of strength throughout this turmoil, the US Dollar, fared well, rising +2.41% for the month. The strength of the US Dollar further exacerbated global equity returns (as they are priced domestically in $USD).
While geopolitical conflicts can bring significant market volatility, this is not a new phenomenon. The following chart highlights the performance of the markets over a century of conflict
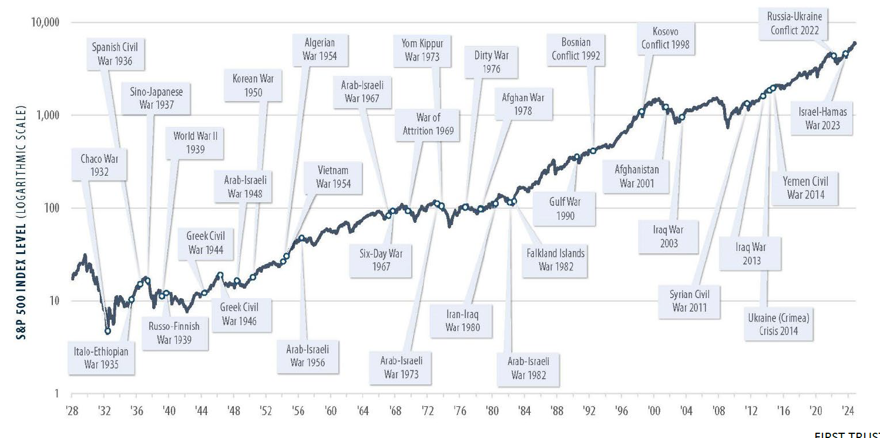
What we experience during times of conflict is increased volatility and a wider spread of returns versus historical averages. A couple points of interest: first, wars and armed conflict are often considered a boon to economic growth. The supplies needed to wage war often require significant investments in production and capacity, which increases total domestic production. In prior conflicts, governments had to ration goods and supplies for the consumer sector to create capacity for war-time production. This is reflected in the economist Paul Samuelson’s 1948 adage of ‘Guns versus Butter’ – government spending vs consumer spending. Those days are behind us. Today, it is not a question of determining what to produce, we simply produce all of it. The markets have typically done well too. We’ve seen annualized returns above average for many periods of conflict – World War 1, Korea, and the Gulf War just to name a few.
Economists and market forecasters create models to try and predict, given a set of inputs, an output that has a high likelihood of occurring. The current conflict’s inputs are spiking energy costs and the models must first estimate how long energy prices remain high. If the duration of high energy prices is fairly short, a couple of weeks to a few months, the impact will be easier to “look through” as a short-term blip that will resolve itself and normalize in the markets. However, if energy prices remain high for the rest of the year, there will be a negative impact on the economy from a few different perspectives. First, lower income households spend a significant (>10%) amount of their take-home pay on energy – heat, electricity, gasoline. Thus, higher energy prices have an outsized impact on their household budgets, and they may need to trim spending elsewhere. In aggregate, this change in consumer behavior may lead to decreased spending. Second, oil is an input in many products aside from gasoline; it is used in textiles, plastics, and a wide range of goods. If the price of oil remains high, it would increase the cost of those goods to produce, and there is a likelihood that those costs will be pushed onto the consumer, creating an inflationary environment. Third, the cost to transport goods increases; a pallet of goods getting transported from the port of Long Beach, CA to Reno, NV, for example, costs significantly more when diesel is $7.00/gallon versus $3.50.
The fear of an inflationary environment led interest rates to generally rise during the month of March. The US Aggregate Bond Index fell -1.76% for the month. As we know, as interest rates rise, the value of bonds fall.
Interestingly, the rise in interest rates overpowered the safe-haven demand for US Treasuries; typically investors view them as a “flight to safety” asset class and historically they do well in volatile markets. We have not seen that play out so far.
A Look Forward
Our focus now is on corporate earnings. With the close of Q1, we will listen to corporate earnings calls and get commentary from CEOs and CFOs of publicly traded companies on their business performance and expectations. The markets are anticipating an all-time high in earnings per share of $335 across the entire S&P 500. In the simplest terms, the stock market can be valued as such: how much money do companies make per share, and how much of a multiple are we willing to pay for those earnings. Those inputs lead to the “Price to Earnings Ratio,” a widely used data point. The chart below shows the expectation for earnings per share as well as the index levels since Liberation Day, nearly a year ago.
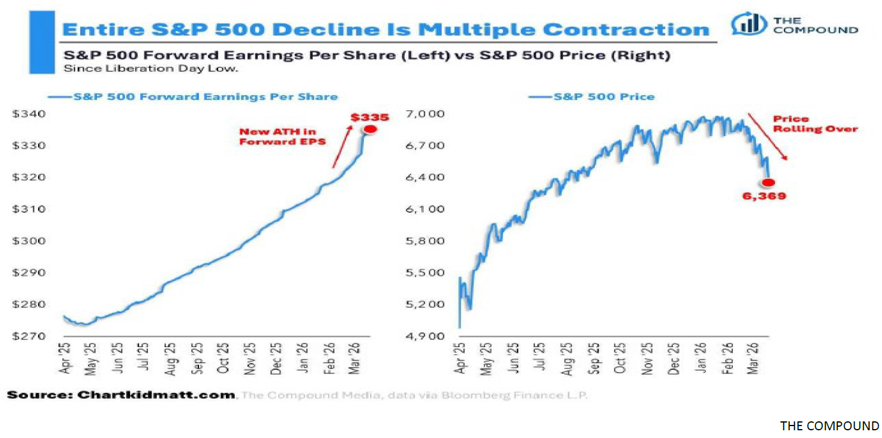
Two things: If the expectation is for record corporate profits, and the current value of the index is lower, that tells us that stocks are a better value to investors than they have been. Our team has a level of cautious optimism that the bull market, while it stumbled in March, will not fall flat on its face.
Regarding portfolio positioning, we remain fairly neutral to our targets with a slight bent towards value in our equity portfolios. On the fixed income side, we are a bit more conservative in our bond portfolios. Having exposure to shorter duration bonds helped us in March as they were better insulated from rising rates further out on the yield curve. We have the Fed meetings, the midterms, and a ceasefire on the horizon. We will not be surprised by continued volatility throughout the year but will remain steadfast in our belief that over the long term, stock and bond markets continue to reward the owners of those securities. As I sit here today, the S&P is down only -0.25% year to date and off just 2.5% from its all-time high. Not a bad place to be, considering geopolitical events.