
Quarterly Review and Outlook:
December 2025
"Have You Ever Seen The Rain"

LJohnson@fcbanking.com
412-208-7687
Connect on LinkedIn
A Look Back
The above title is from a song written and recorded by the legendary band, Creedence Clearwater Revival...more popularly known as CCR. It was released as a single in 1971 from the album Pendulum, peaking at #8 on the Billboard chart. The lyrics of the song always intrigued me, and after hearing it on a holiday drive recently, I decided to dig a little bit. Reviewers at the time thought the lyrics were about the decline of the countercultural idealism of the 1960’s as we moved into the Nixon administration. When interviewed, lead-singer John Fogerty said that it concerned tensions within the band and that the lyrics were inspired by the “unease and depression at the height of their fame and commercial success.” Now, the line, “have you ever seen the rain, coming down on a sunny day?” makes more sense. Both things, good and bad, can coexist. Really, isn’t that what we face much of the time in life, the economy and financial markets? Things are not typically all bad or all good. We believe that we are seeing that play out currently as we examine our economic situation and our financial markets.
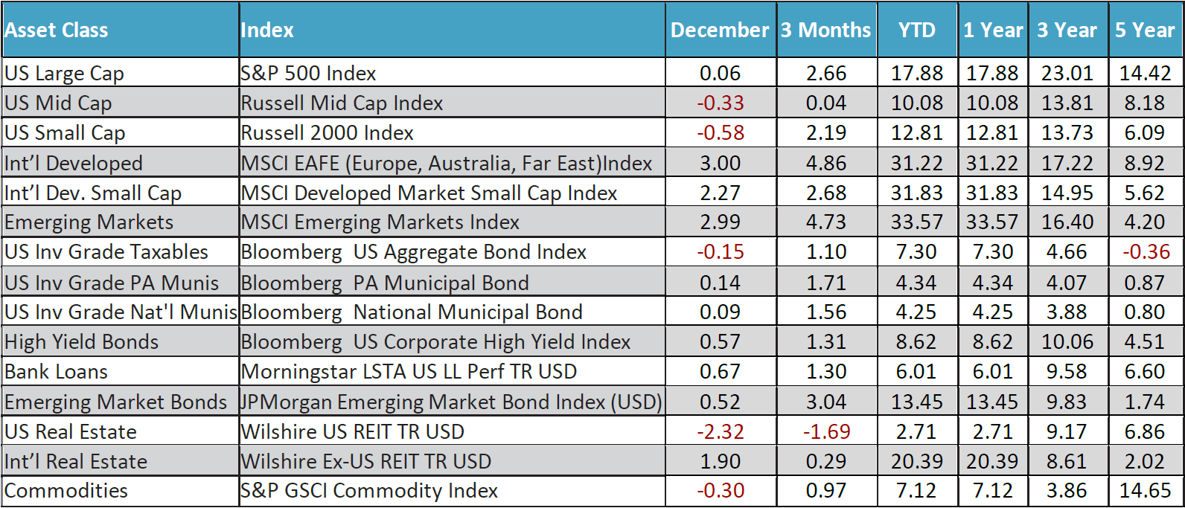
It is difficult to look at the table of returns for 2025 above and not have a smile on your face. Large-cap U.S. stocks delivered a nearly 18% return for the year. What really stands out is the three-year annualized number of 23%. Remember, the long-term average for this index is around 10%. International stocks reminded us of all why it is important to build a diversified portfolio of asset classes. Developed International and Emerging Market stocks both returned over 31% for the year, or around 14% more than the already impressive S&P 500 return. The global AI boom specifically benefited Asian countries like South Korea, Taiwan, and Japan. Further, a weaker U.S. dollar made foreign investments more attractive, while relatively high valuations here in the states prompted a shift to cheaper international markets. Finally, core bonds, as noted by Bloomberg Aggregate, showed a 7.30% return over 12 months. That is significant and nearly 2% more than the average.
A simple 50/50 allocation between the S&P 500 and the Bloomberg Agg returned 12.59% (17.88*.5 plus 7.3*.5=12.59). Now, let’s say you carved out a 25% allocation to international stocks in 2025…that would have changed your stock performance to 21.24% (17.88*.75 plus 31.35*.25=21.24). With that a balanced allocation would then be 14.27%, a difference of 1.68%. On a $1,000,000 portfolio that would generate an additional $16,800 of return…and on a $20,000,000 portfolio, you would have received an additional $336,000! That matters. We don’t typically go through a lot of math in these writings, but we think it is important enough to point out. Sometimes, we get so comfortable…maybe too comfortable… just looking at and talking about percentages in our business. Small differences in return can make a big difference down the road. We just looked at one year here. Imagine that same kind of difference compounded out for 10, 15 or 20 years. It is truly why we continue to talk about and construct client portfolios with a diversified asset allocation approach
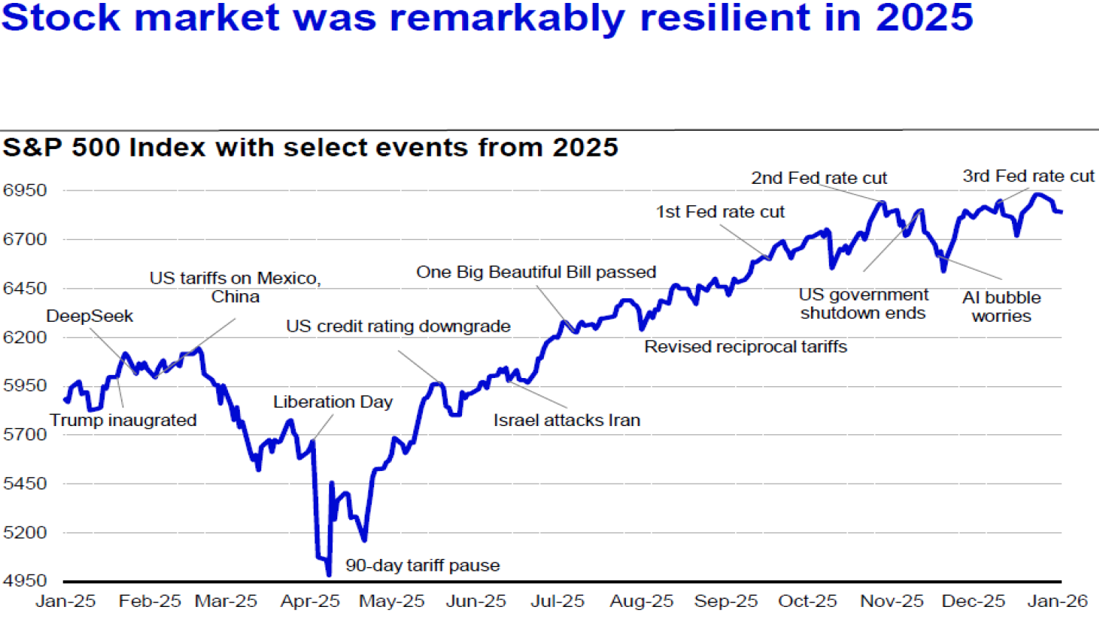
The above chart shows just how resilient 2025 was. There was a substantial selloff after the initial announcement of tariffs, dubbed Liberation Day, on April 4th. The S&P 500 fell by about 12% in the days immediately after the news. By May 13th, the index turned positive and by June 27th it printed all-time highs. Other important events throughout the year are noted, but the Large-Cap index rallied over 41% from the April low to the end of December as various deals with countries were reported and the Fed started to lower short-term interest rates.
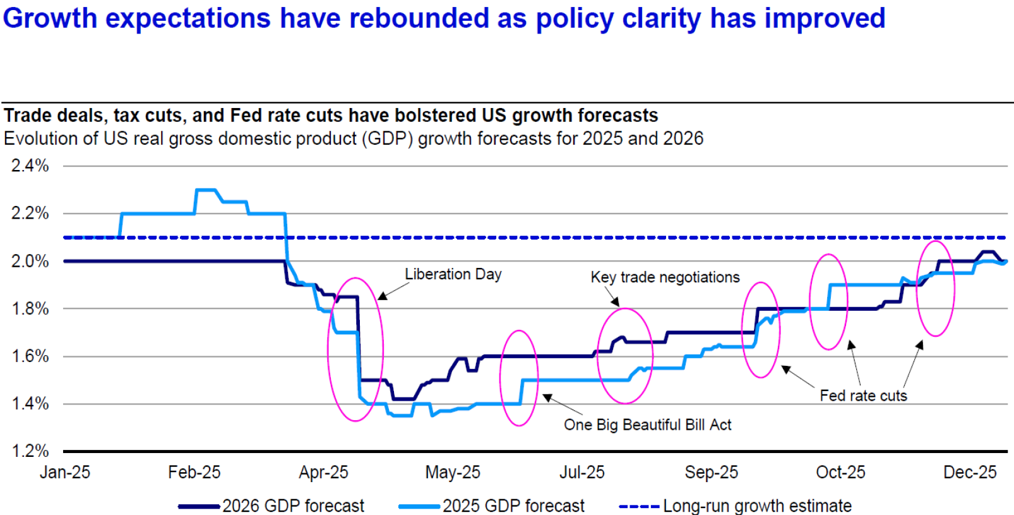
The chart above shows how the combination of trade deals, tax cuts and rate cuts improved the expectations of growth in the U.S. The Fed cut rates three times, all coming in the last four months of the year. This brought the range down from 4.25-4.50% to 3.50-3.75% currently. As we know, stocks tend to outpace cash and bonds over time, but they typically do even better in a declining rate environment. As money becomes easier, companies/individuals borrow and invest…with lower debt service, company earnings grow, etc. At least, that is the plan…There are scenarios where, even with lower rates, stocks can struggle…but that is not where we are currently.
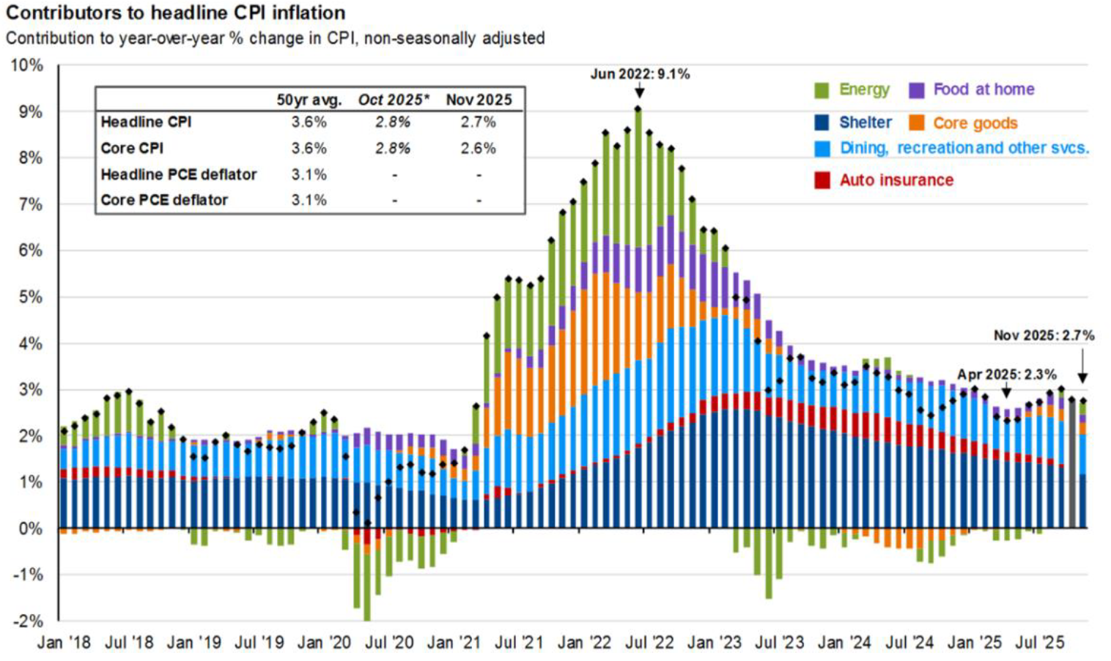
Inflation has probably been the most talked-about economic indicator over the last three-four years. The chart below shows how inflation in the U.S. spiked in 2021 after our economy re-opened following Covid in 2020. Inflation ultimately peaked in 2022 and has been steadily declining since. In addition, the chart below shows how the main contributors have changed over time. While energy was a big component in 2021 and 2022, it’s been muted or even negative since. As we all know, the cost of dining out has continued to weigh on the average family. The cost of auto insurance has increased substantially, along with property and health. We focus on inflation because it really can be an economy killer. To the extent it affects middle and lower-income families disproportionately…and it does, economic growth becomes much more dependent on the higher income brackets. Just like we talk about the health of the stock markets being stronger when it is more inclusive and broader, the same is true in our overall economy. We are a much healthier society when more and more are able to drink from the trough
A Look Forward
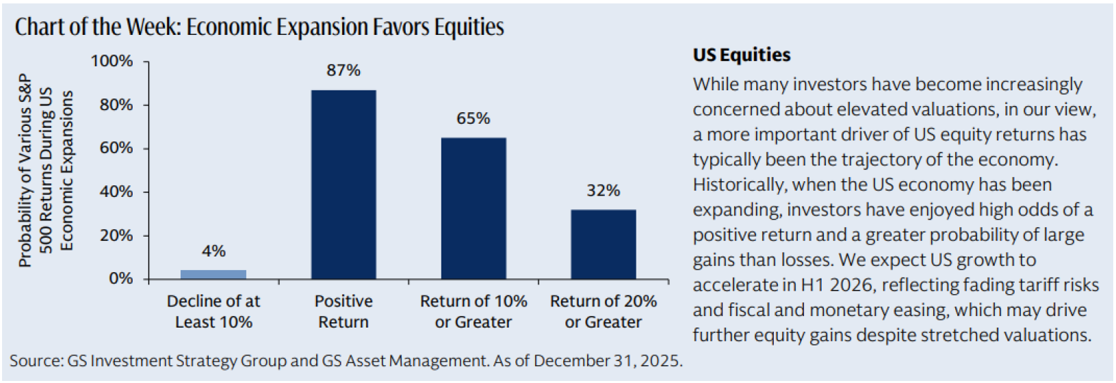
As we look forward, we are reminded of the lyrics…” rain coming down on a sunny day.” Growing corporate balance sheets that lead to growing economic situations tend to be favorable to stocks. Even though valuations for the S&P 500 are admittedly above the long=term average, the chart below makes a compelling case for the correlation between economic growth and positive stock returns. In fact, returns have been positive 87% of the time when our economy is expanding. Historically, when that was not the case, it was later stages of economic expansion that financial markets were in front of an impending negative event. Could that be the case now? Well, of course it could, but at this time we do not see the typical signs that would suggest a recession is imminent. Unemployment remains well under 5%. Although dispersed, people are still spending. Companies are still showing positive earnings and making money…all good signs currently for the financial markets.
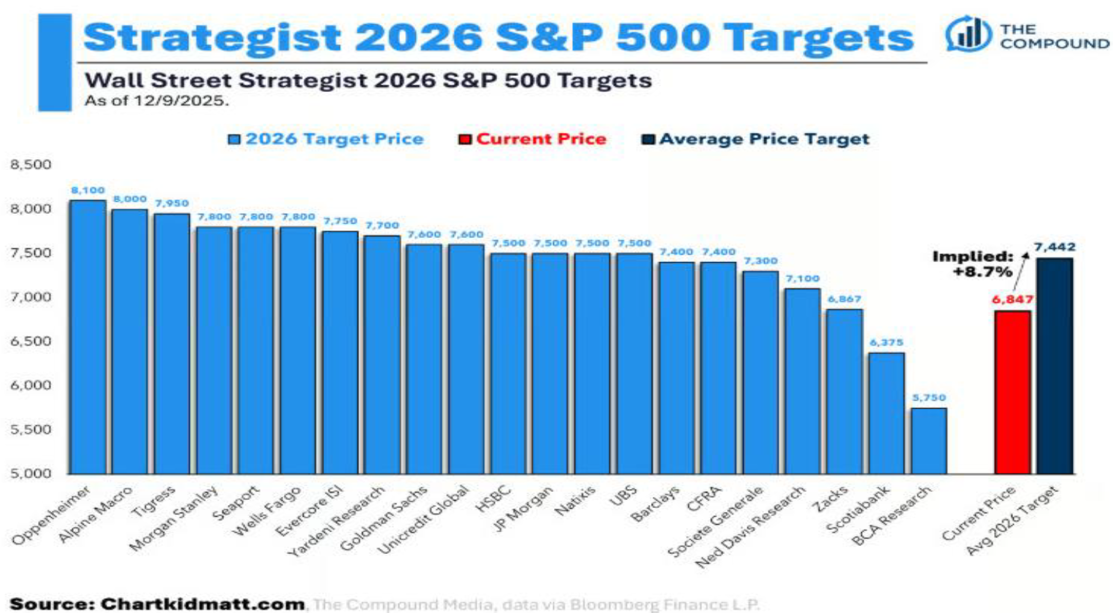
The chart below shows what Wall Street strategists feel about the S&P 500 for 2026. The most optimistic is Oppenheimer with an 8100 target on the index, while BCA is not sold and had a year-end target of 5750, or an overall decline of around 16%. The average of all the projections equals an index level of 7442, which would imply a return of 8.7%. We think that is a more reasonable expectation. Unless the entire risk paradigm changes, the three-year annualized return of 23% that we mentioned earlier from 2023-2025 should not be the reasonable expectation over the next three years. Sure, it could happen…but an awful lot would have to go right for that to become reality.
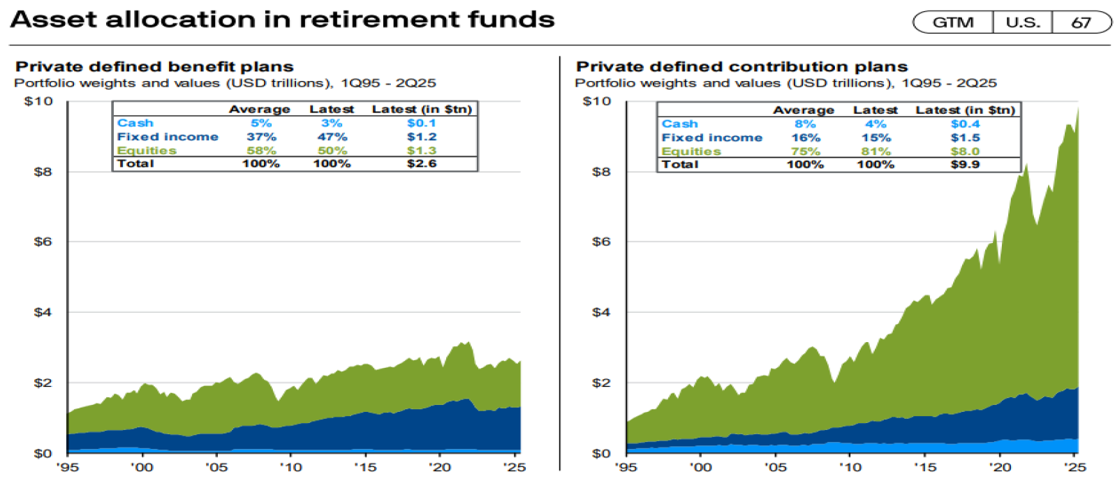
We end with an interesting chart that compares defined benefit, or pension fund allocations compared to what most people refer to as traditional 401k’s, or defined contribution plans. Although pension funds are more balanced in their allocations to stock and bonds, individuals have gotten much more aggressive, with around 80% in stocks currently. That’s been good lately, but if it rains a little heavier, the sun may be a little more difficult to see!
We remain neutral in our allocation between stocks and bonds, with a bias toward quality. We also believe that international stocks can continue their momentum from last year as valuations look more reasonable after years of underperformance versus the U.S. Large-Cap S&P 500. We will have challenges, as we always do…mid-term elections are coming in 2026, affordability issues, geopolitical challenges, etc. And we will not be surprised to catch a little rain, even on a sunny day...